TradeTrack
Integrated Trade Journaling with Live Chart Intelligence
TradeTrack isn't just a journaling tool—it's a responsive, intelligence-powered interface that captures both the decision and the data behind every trade. With real-time TradingView embeds, automated chart parsing, and a system that adapts to strategy and structure, it brings precision and context to the heart of performance tracking.
The Challenge
Trade journaling is one of the most proven methods for improving trading performance—but traditional tools make it hard to keep the habit.
Most platforms require traders to manually upload screenshots, link charts to trades, and manage disconnected spreadsheets or note apps. It's slow, disruptive, and lacks the real-time context needed for high-performance analysis.
Traders needed a solution that could meet them where they are—in flow, in market, and in motion.
⚙️ The 9Mirrors Solution
TradeTrack was built to streamline and elevate the trade journaling process—bringing together real-time data, embedded visual context, and customizable strategy logging into one fluid experience.
It's not just another tracking tool—it's an intelligent reflection system for how traders actually work, learn, and evolve.
🛠️ Behind the Build
TradeTrack's architecture was designed for speed, clarity, and future growth. It features a custom chart parser that extracts and stores meaningful chart context, and a lightweight frontend system that renders these visuals on demand with no tradeoff in performance.
It's built to scale—from solo traders to institutional teams—and integrates seamlessly with any data layer or trading platform in future releases.
🌱 The Result
TradeTrack delivers more than just journaling—it delivers clarity, rhythm, and structure to the way traders reflect on their decisions.
It helps turn a reactive process into a refined practice—aligned with the 9Mirrors ethos:Make the invisible visible. Make the routine intelligent. Make progress repeatable.
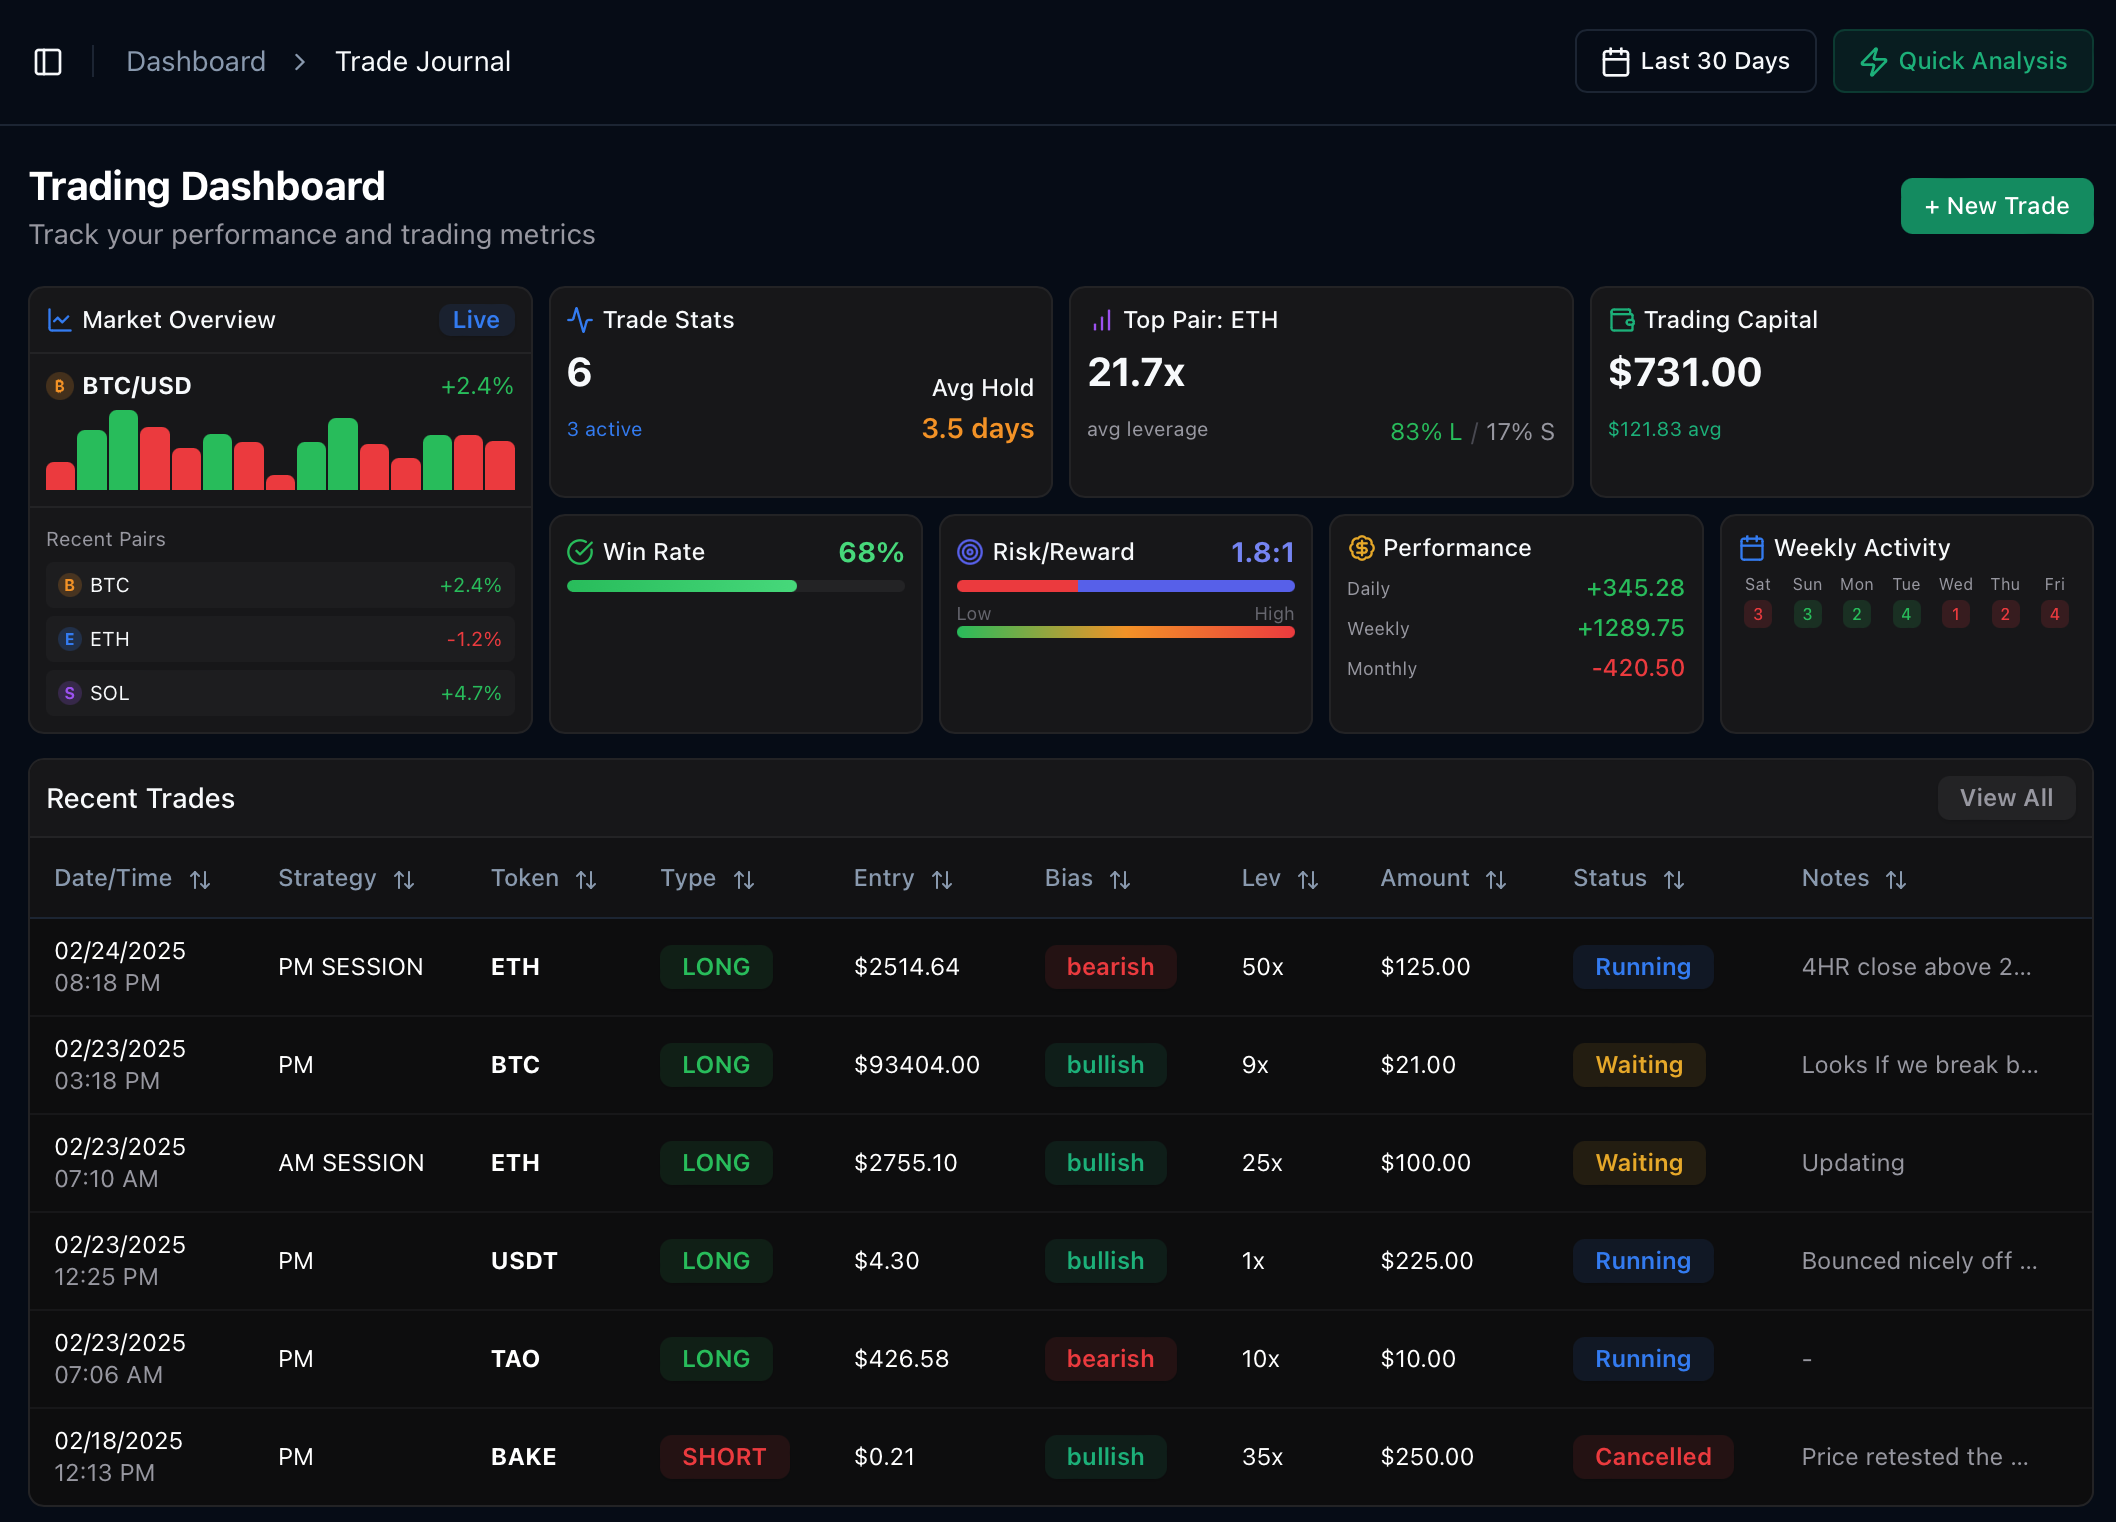
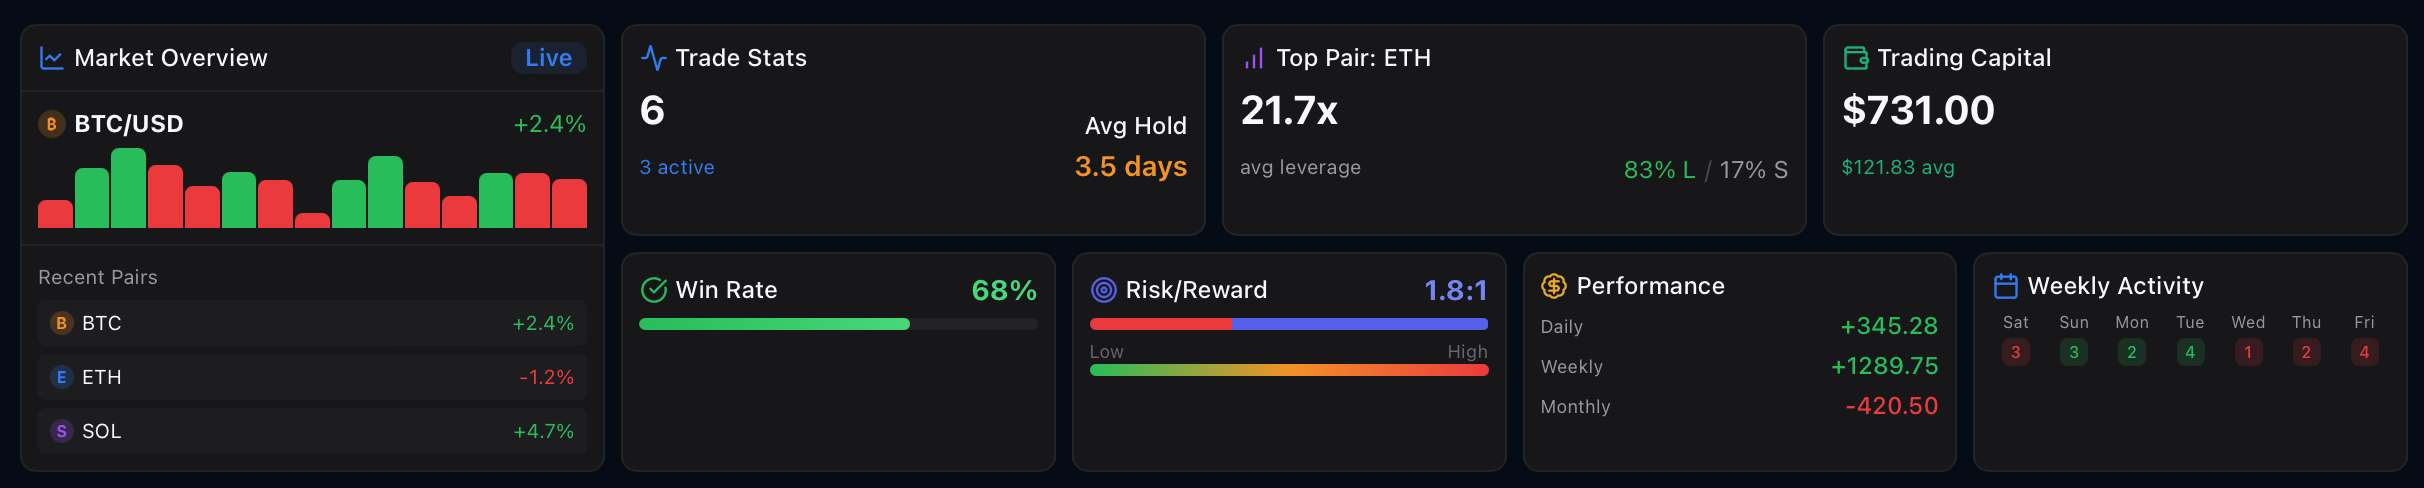
Analytics That Tell The Story
Powerful metrics visualization built right into the core experience.
Instant win/loss ratio visualization
Performance breakdown by strategy
Risk metrics clearly presented
Daily, weekly, and monthly performance at a glance
Key Features
Thoughtfully crafted capabilities that make TradeTrack a truly transformative experience.
Performance Dashboard
A clean, modern layout that surfaces key metrics:
•Risk/reward ratios
•Win/loss breakdowns
•Average holding times
Traders can toggle across daily, weekly, and monthly views to assess progress over time.
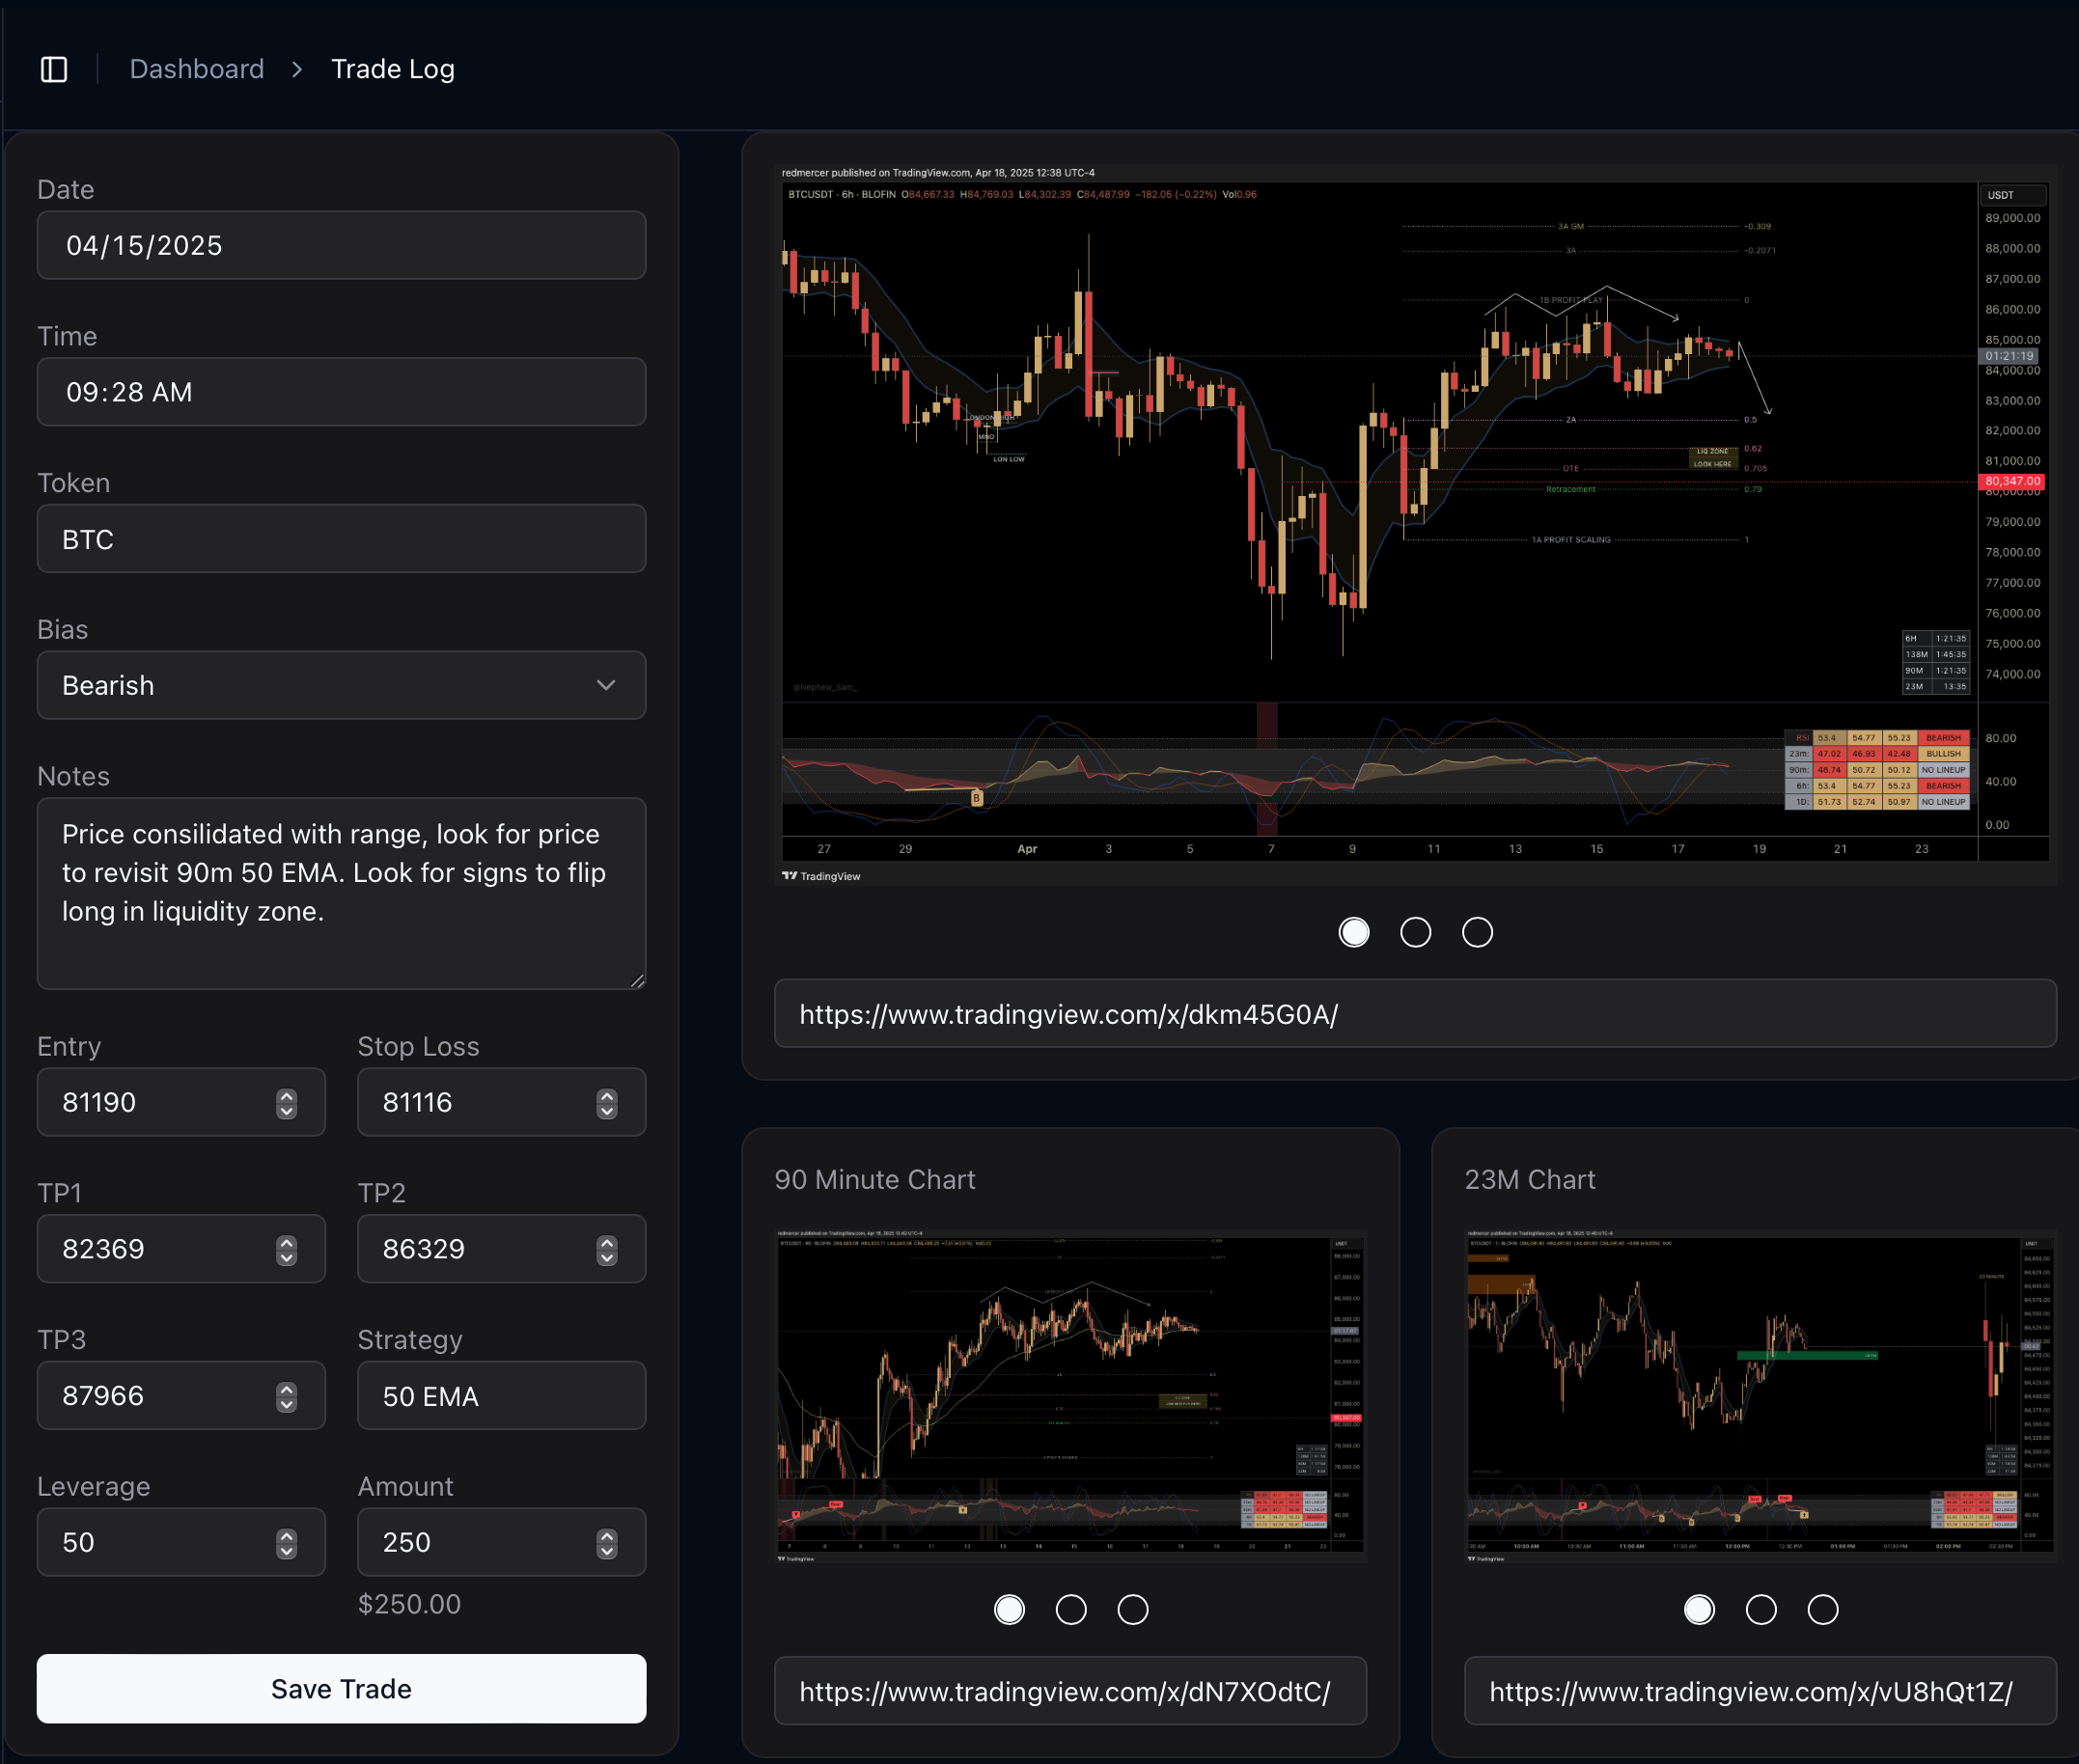
TradingView Integration
Copy and paste a TradingView link, and the full chart appears with all elements intact:
•Complete with annotations
•Preserves timeframes and drawings
•No uploads or screenshots needed
Every trade entry becomes a living snapshot of the market moment.
Strategy-Aware Logging
Create and tag trade templates by:
•Strategy type
•Risk profile
•Market condition
Traders can track what works (and what doesn't) with precision across different setups and timeframes.
Contextual Analysis
Each trade entry is automatically enriched with metadata:
•Symbol
•Timeframe
•Market movement at entry
This allows for structured filtering and detailed performance review across your trading history.
Ready to transform your trading insights?
Explore how our intelligent solutions can help you capture and analyze your trades with unprecedented clarity and ease.
Learn our process